AqDiagram
Library to create simple diagrams. Work in progress.
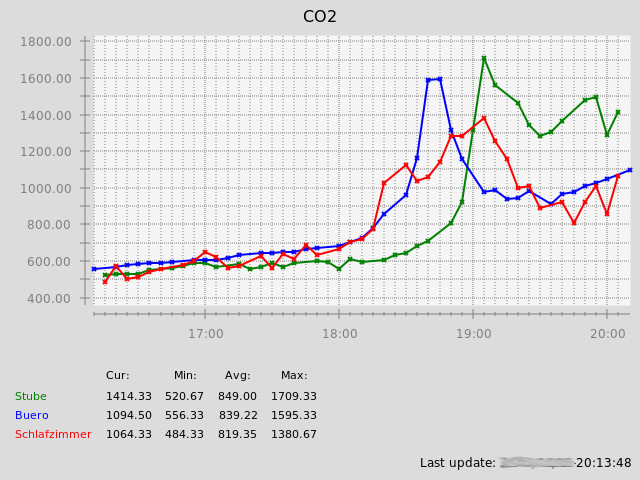
A diagram can contain multiple curves.
Example Graphs
Example 1
Building AqDiagram
Download and unpack tar.gz file, CD into the unpacked folder and build like this:
mkdir build
cd build
gwbuild -s ..
gwbuild -p
gwbuild -Btm2builder (not needed with newer versions of gwenbuild)
gwbuild -jNN (with NN number of parallel processes, e.g. 4 for quadcore cpu)
sudo gwbuild -i
Code Examples
Simple Graph with a Single Curve
  AQDG_GRAPH *g;
  AQDG_GRAPH_DATAPAIR_LIST *dpList;
  AQDG_DRAW_CONTEXT *dc;
  AQDG_OBJECT *graphObject;

  g=AQDG_TimeGraph_new("Title", "Subtitle", "Value", "mm", 0);

  /* get data to be shown (insert your function here) */
  dpList=CREATE_DATA_FOR_GRAPH();

  /* add single curve as line graph */
  AQDG_TimeGraph_AddCurve(g, "Testdata", AQDG_GRAPH_TYPE_LINE, dpList);

  /* setup ticks for X and Y axis (use auto-calculated upper and lower limit) */
  AQDG_TimeGraph_SetupTicks(g, 0, 0.0, 0.0);

  /* draw graph as PNG file (here with 800x600 pixels) */
  dc=AQDG_Draw_ContextCairo_Png_new("/tmp/testgraph.png", 800, 600);
  graphObject=AQDG_GraphWidget_new(NULL, AQDG_OBJECT_OPTIONS_STRETCHX | AQDG_OBJECT_OPTIONS_STRETCHY, dc);
  AQDG_Object_SetWidth(graphObject, 800);
  AQDG_Object_SetHeight(graphObject, 600);

  /* use default pens and fonts */
  AQDG_GraphWidget_SetupDefaultPens(graphObject);
  AQDG_GraphWidget_SetupDefaultFonts(graphObject);

  /* finish creating the PNG file */
  AQDG_GraphWidget_FinishWithGraph(graphObject, g);

  return 0;
Graph with a Bar Graph and a Derived Line Curve
  AQDG_GRAPH *g;
  AQDG_GRAPH_DATAPAIR_LIST *dpList;
  AQDG_GRAPH_DATAPAIR_LIST *derivedDpList;
  AQDG_DRAW_CONTEXT *dc;
  AQDG_OBJECT *graphObject;

  g=AQDG_TimeGraph_new("Title", "Subtitle", "Value", "mm", 0);

  /* get data to be shown (insert your function here) */
  dpList=CREATE_DATA_FOR_GRAPH();

  /* add first curve as bar graph */
  AQDG_TimeGraph_AddCurve(g, "Testdata", AQDG_GRAPH_TYPE_BARS, dpList);

  /* use a data modification function on initial data (here: accumulate) */
  derivedDpList=AQDG_Data_Accumulate(dpList);

  /* add 2nd curve with accumulated data as line graph */
  AQDG_TimeGraph_AddCurve(g, "Accumulated", AQDG_GRAPH_TYPE_LINE, derivedDpList);

  /* setup ticks for X and Y axis (use auto-calculated upper and lower limit) */
  AQDG_TimeGraph_SetupTicks(g, 0, 0.0, 0.0);

  /* draw graph as PNG file (here with 800x600 pixels) */
  dc=AQDG_Draw_ContextCairo_Png_new("/tmp/testgraph.png", 800, 600);
  graphObject=AQDG_GraphWidget_new(NULL, AQDG_OBJECT_OPTIONS_STRETCHX | AQDG_OBJECT_OPTIONS_STRETCHY, dc);
  AQDG_Object_SetWidth(graphObject, 800);
  AQDG_Object_SetHeight(graphObject, 600);

  /* use default pens and fonts */
  AQDG_GraphWidget_SetupDefaultPens(graphObject);
  AQDG_GraphWidget_SetupDefaultFonts(graphObject);

  /* finish creating the PNG file */
  AQDG_GraphWidget_FinishWithGraph(graphObject, g);

  return 0;